Log Viewer
The Log panel displays all TCP traffic — every message sent and received. It supports three viewing modes for different analysis needs.
Log Modes
Switch between modes using the toolbar at the top of the Log panel:
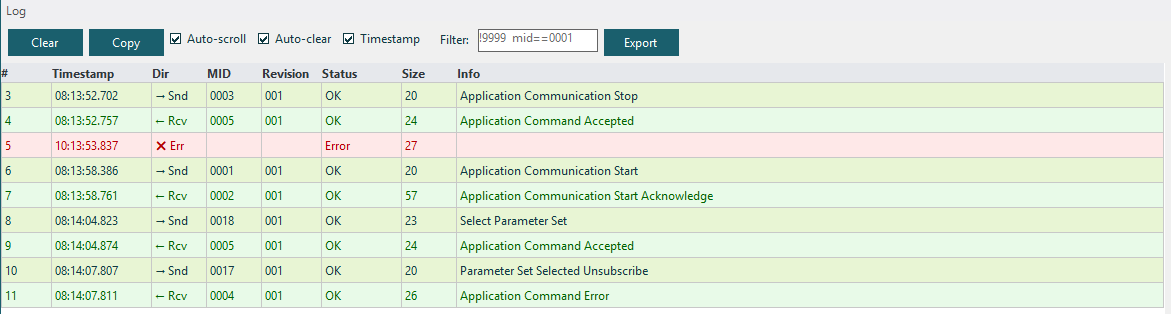
DataGrid Mode
A tabular view with sortable columns:
| Column | Description |
|---|---|
| Direction | SENT or RECV |
| Timestamp | When the message was sent/received |
| MID | Message ID number |
| Description | Human-readable MID name (e.g., "Communication Start") |
| Raw Data | Full ASCII message content |
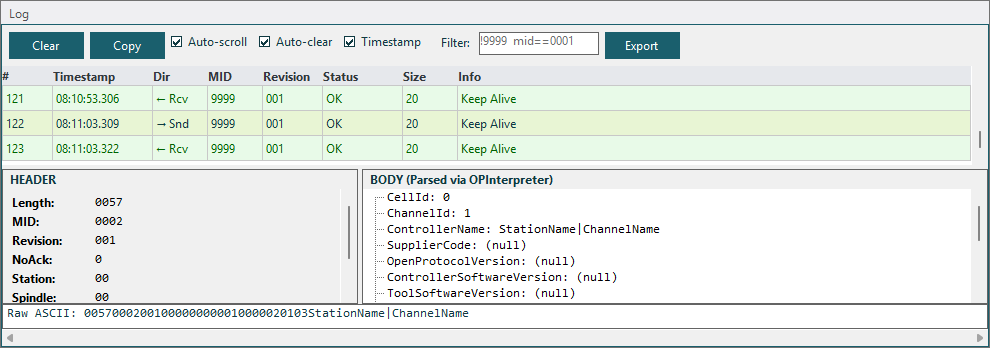
TreeView Mode
A hierarchical view that groups messages and shows parsed field details. Expand a message to see:
- Header fields (Length, MID, Revision, Station, etc.)
- Body fields parsed by the Open Protocol Interpreter
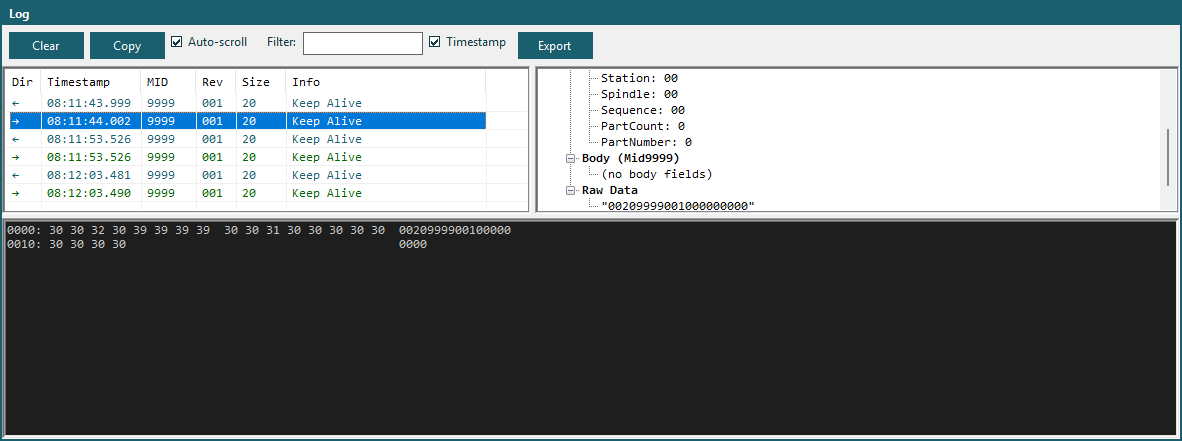
Wireshark Mode
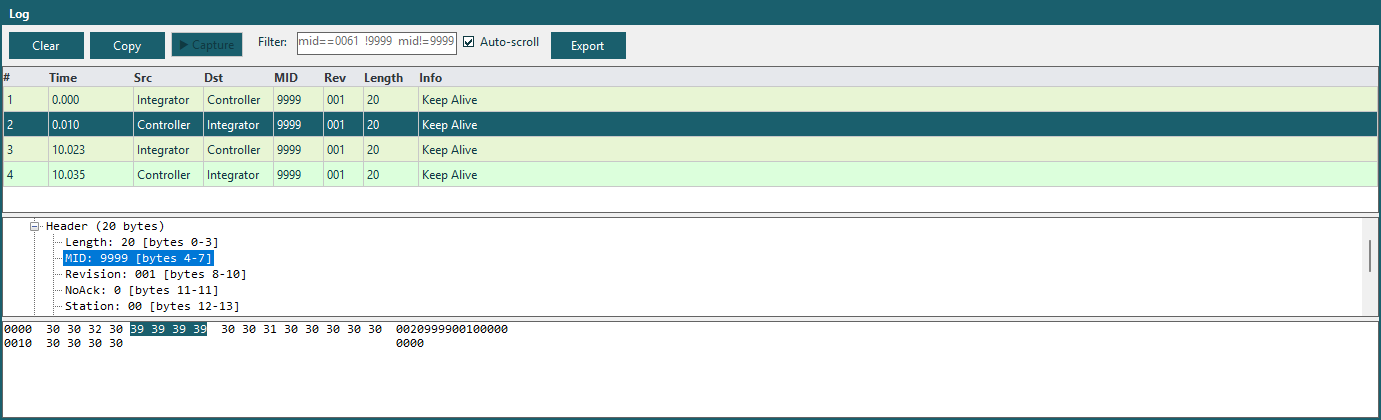
A protocol dissection view inspired by Wireshark. Shows:
- The full raw message in the top pane
- Dissected protocol fields in the bottom pane
- Each field with its byte offset, length, name, and value
- Click a field to highlight its bytes in the raw data
Log Features
Color Coding
Messages are color-coded by type:
| Color | Meaning |
|---|---|
| Blue | Sent messages |
| Green | Received messages |
| Red | Error messages |
| Gray | Keep-alive messages (MID 9998/9999) |
Hide Alive Messages
Use Settings → Hide Alive (a checkbox menu item) to filter out keep-alive messages (MID 9998/9999) that can clutter the log during long sessions. When checked:
- Keep-alive messages are suppressed from logging
- The log viewer filters them from the display
- The setting is persisted automatically and restored on next launch
Auto-Scroll
The log auto-scrolls to show the latest messages. When you scroll up to review history, auto-scroll pauses. Scroll to the bottom to re-enable it.
Clear Log
Click Clear to remove all log entries. The message counter in the status bar resets to zero.
Log Capacity
The log maintains up to 11,000 entries. When the limit is reached, the oldest 1,000 entries are automatically trimmed (keeping the most recent 10,000).
Interactive Log
The Interactive Log panel provides a master-detail view for inspecting protocol traffic:
| Area | Description |
|---|---|
| Toolbar | Clear, Copy, Auto-scroll, Auto-clear, Timestamp, Filter, Export |
| Log grid (top, ~60%) | DataGridView showing log entries in virtual mode |
| Detail panel (bottom, ~40%) | Parsed MID Header fields, Body fields tree, and Raw ASCII |
Click a log row to see its full parsed MID details in the bottom panel. Sending MIDs is done from the individual MID panels — this panel is read-only.